Analysis & Reports
 The calendar for the majority of Win|Win Network Partners includes a large push of campaigning, community organizing, and civic engagement during campaign seasons. Organizations are continually looking to improve their impact and become more effective in pushing the needle in Washington towards racial, economic, and social equity.
Win|Win examines data such as voter turnout and election results to provide high-quality reports and one-on-one strategy support to Network Partners. Seattle's Democracy Voucher Program enabled residents to allocate four $25 vouchers to candidates for local office with the goal of increasing voter engagement and turnout. In 2021, Win|Win published a report analyzing how effective Seattle's Democracy Voucher Program was at increasing voter turnout, especially for voters who had not regularly participated in past campaign cycles. Win|Win's research found that the program was incredibly effective and has supported the case for expanding the program to other areas in Washington and beyond.
In 2022, with the addition of a full time Research Analyst, Win|Win plans to take on additional civic engagement research projects and to dig deeper in primary and election reports than ever before.
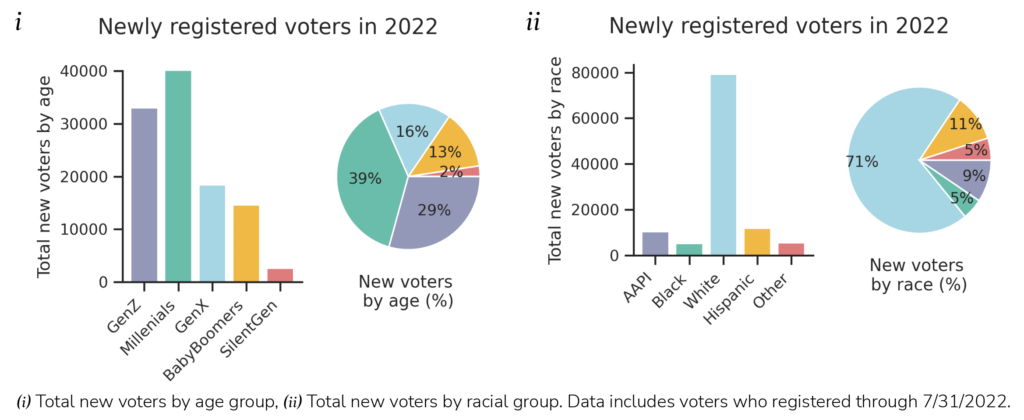
2022 Primary Election Report Excerpts:
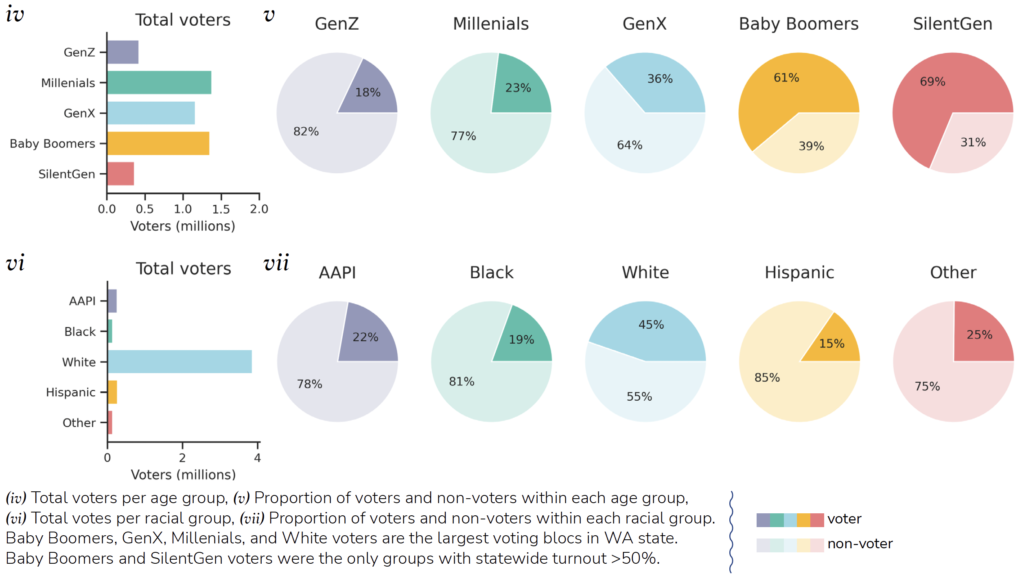
1,941,933 Washingtonians voted in the 2022 Primary Election (40.4%), a 0.5% decrease from 2018.
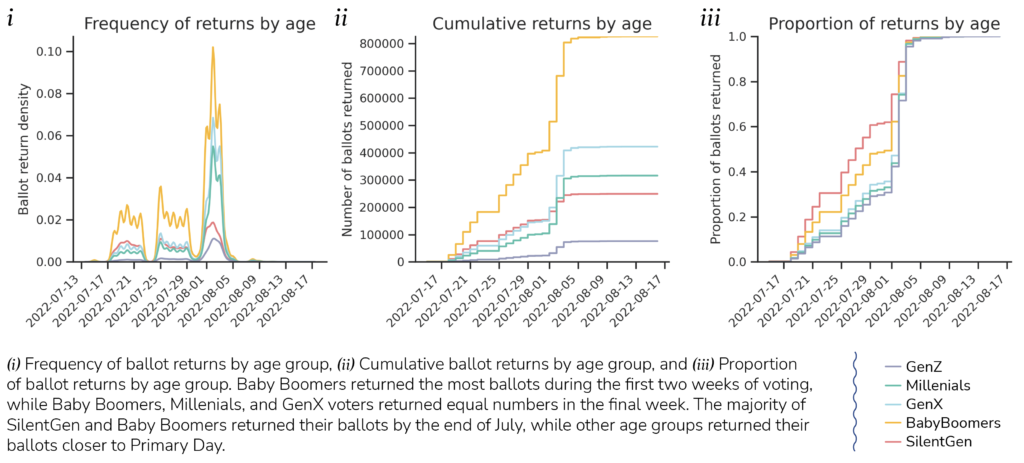
Across the three-week voting period, older voters returned their ballots sooner and at a higher overall rate than younger voters.
In the first seven months of 2022, more than 112,000 Washingtonians registered to vote, increasing the total number of registered voters by 2.3%.